")
")

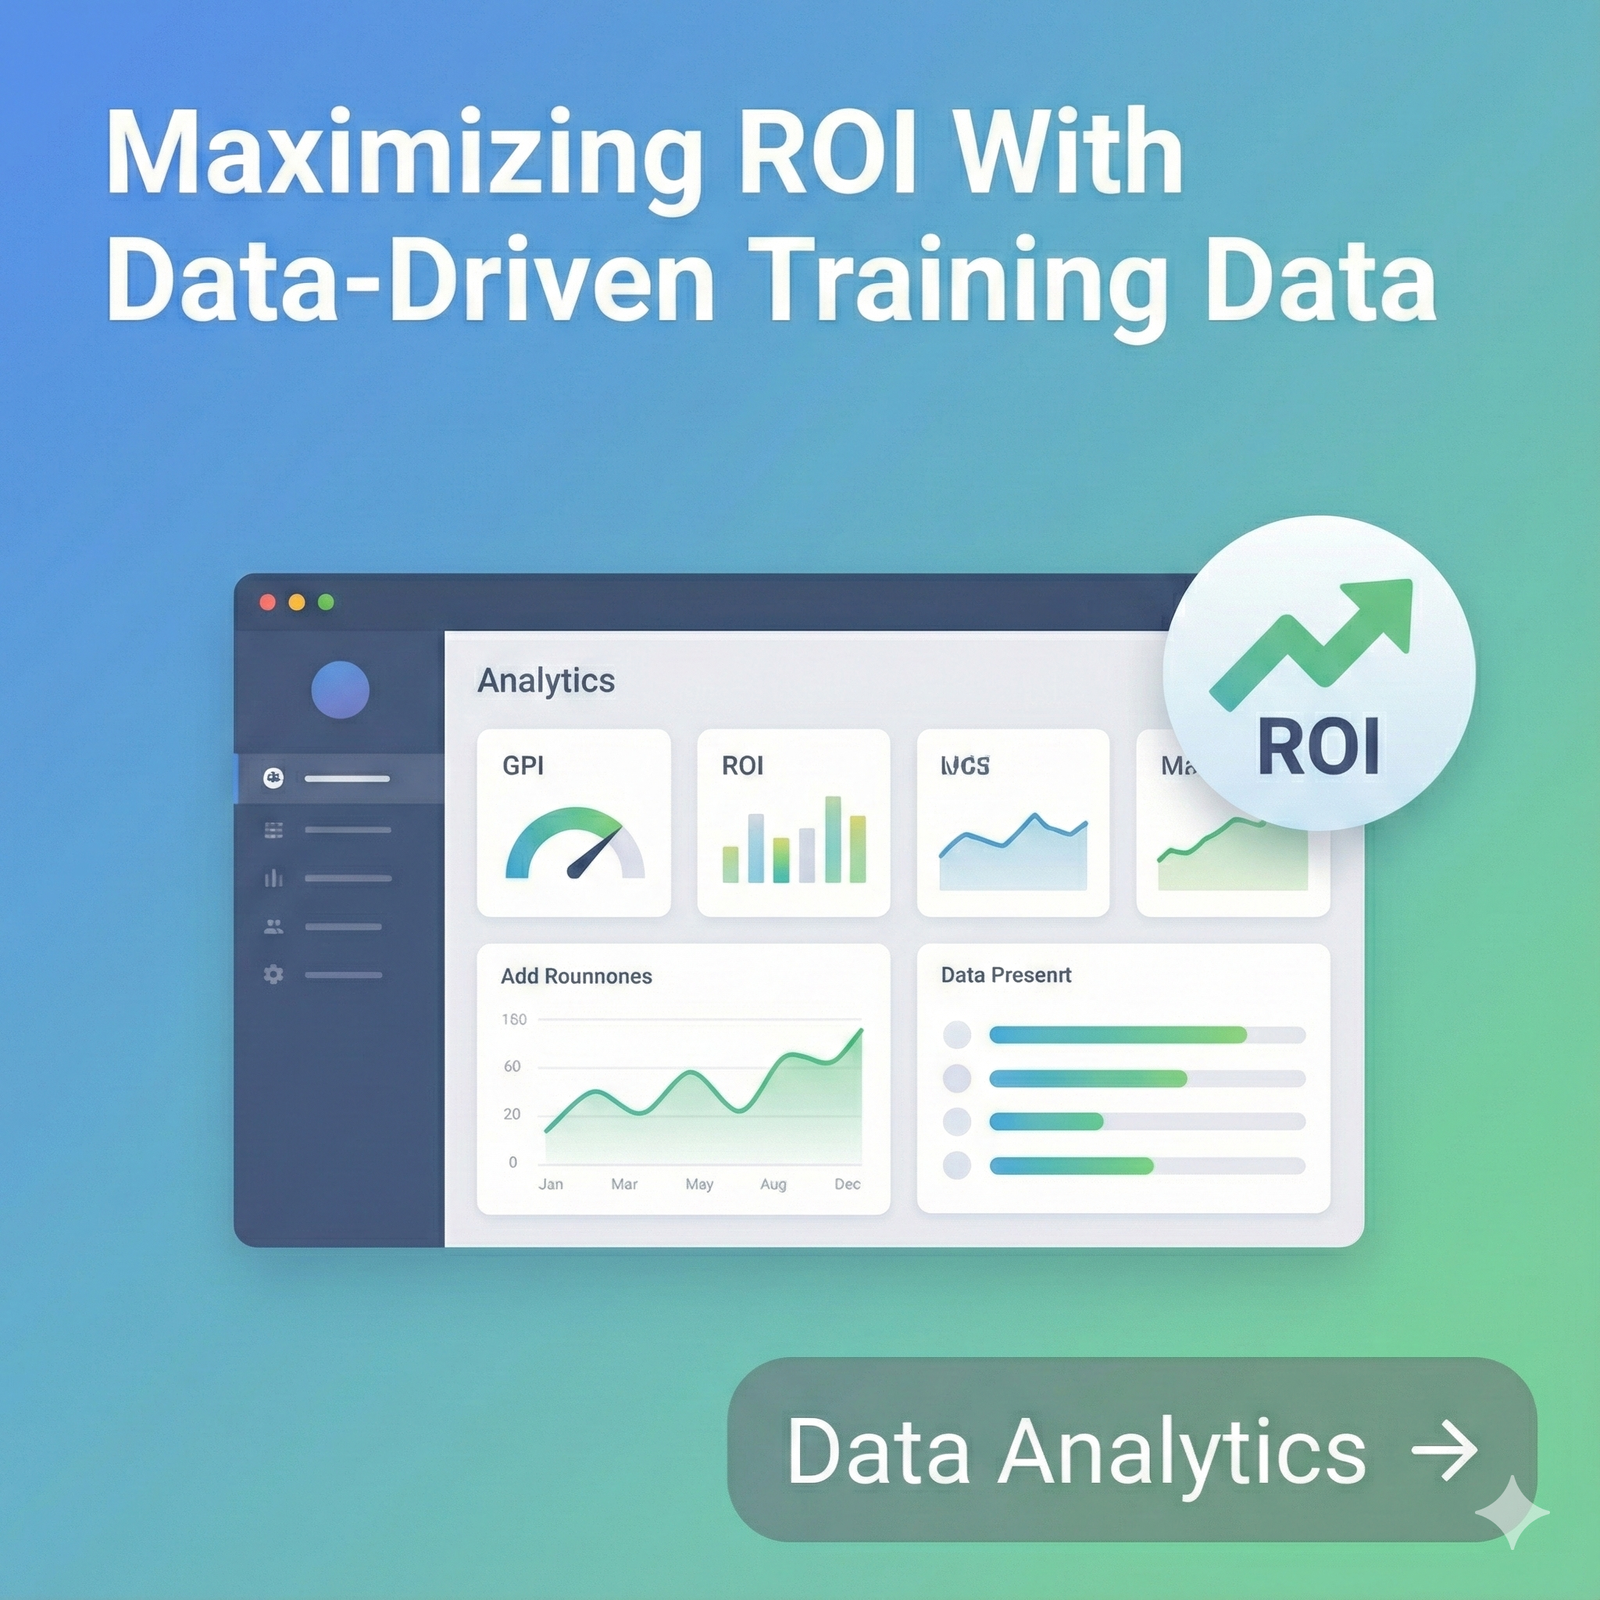
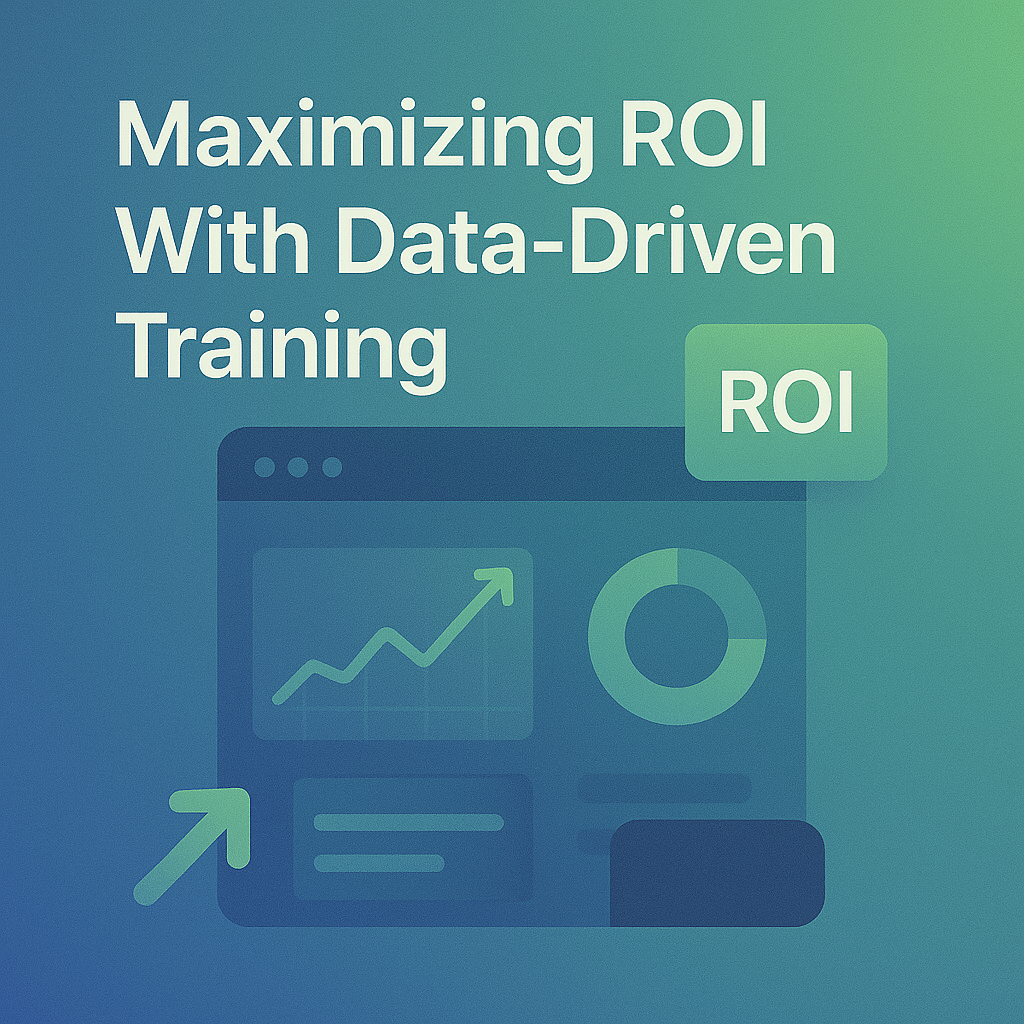
 A learning analytics project built to capture learner behavior, visualize training performance, and support data-informed decisions across the organization.
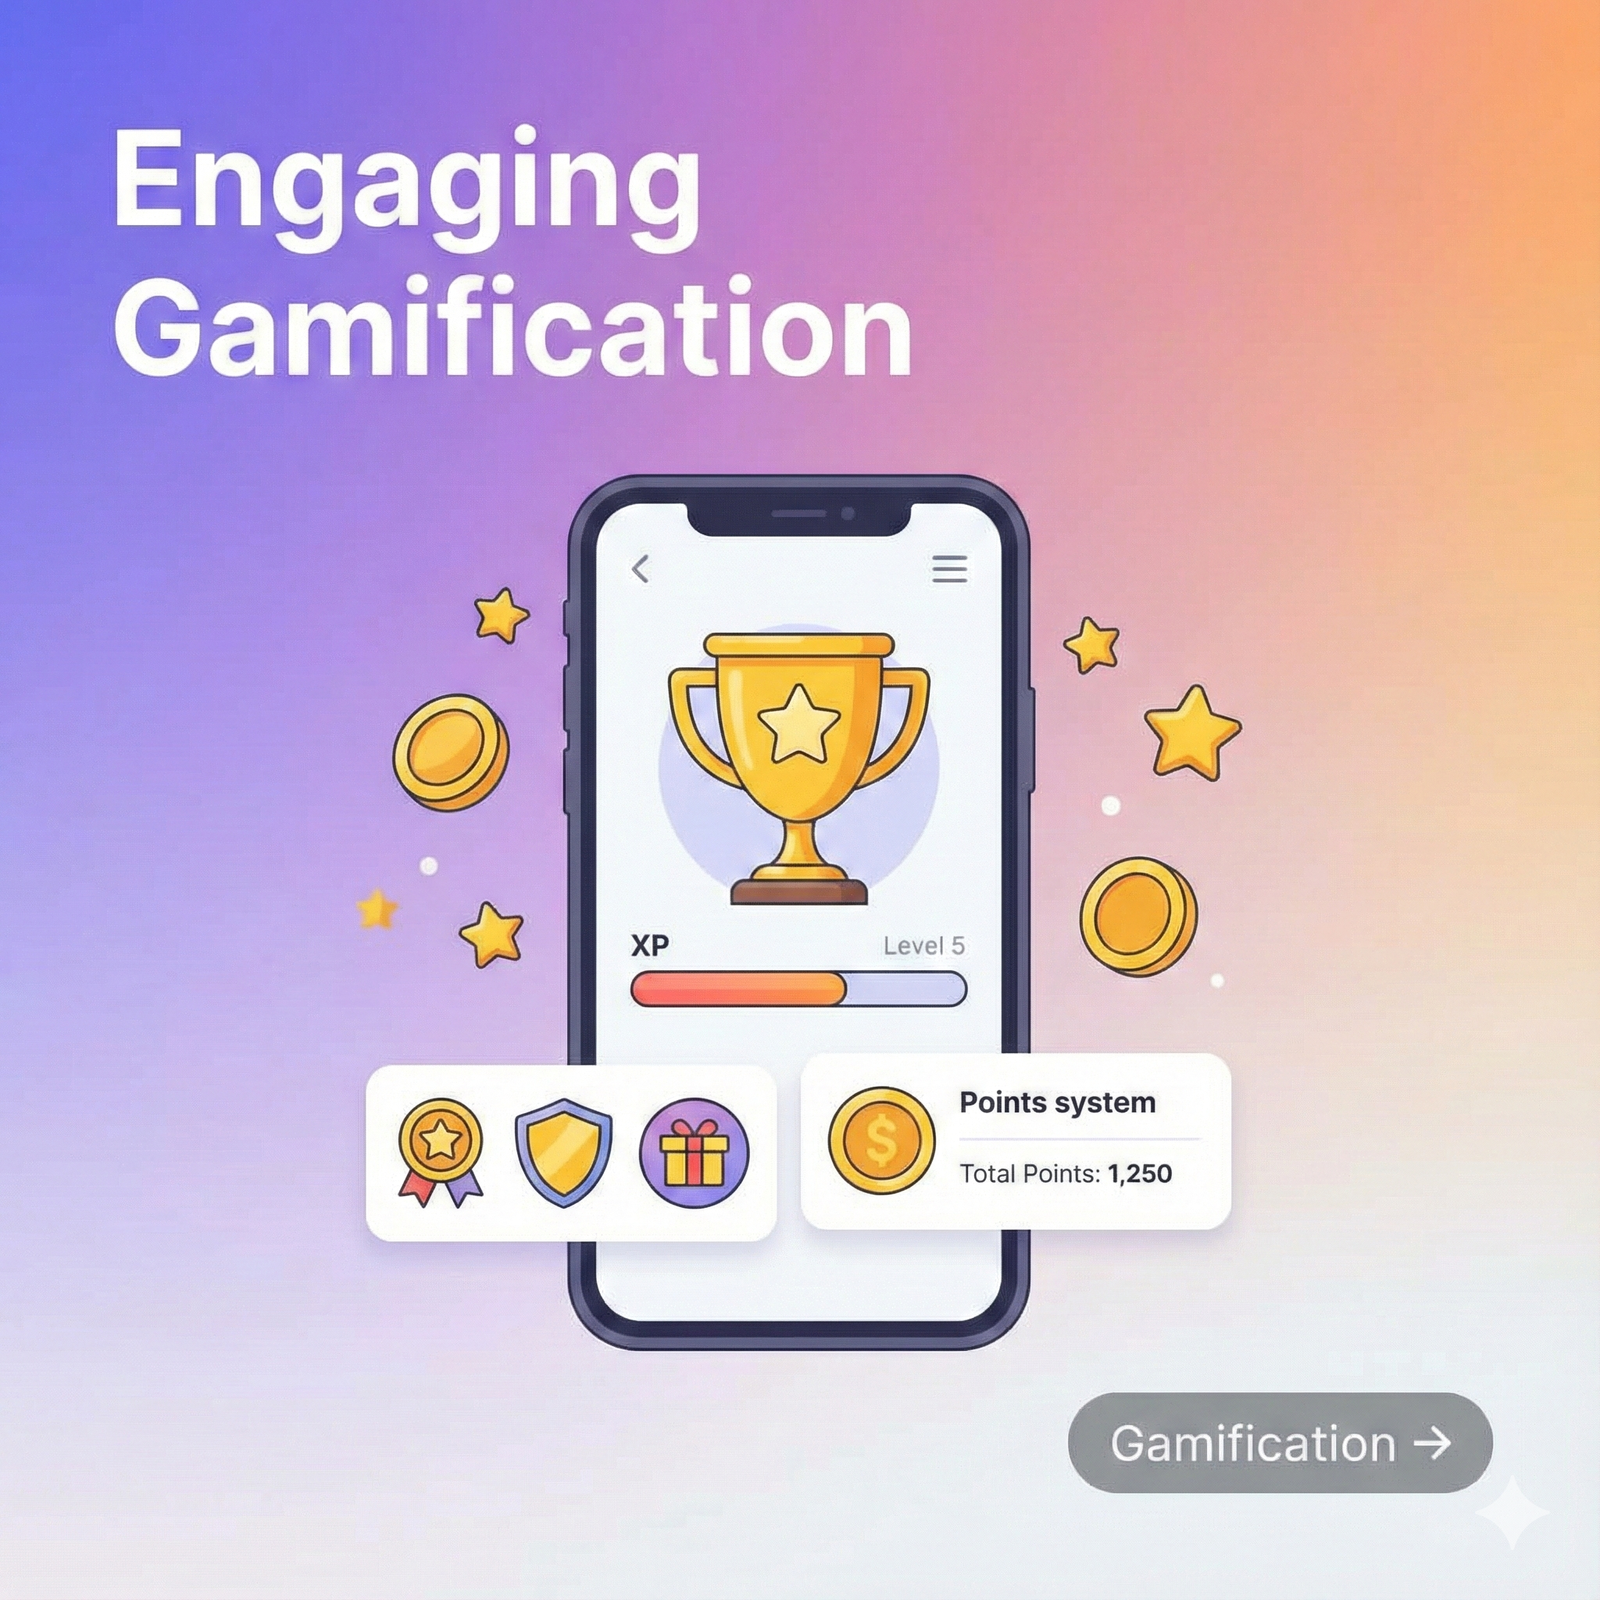
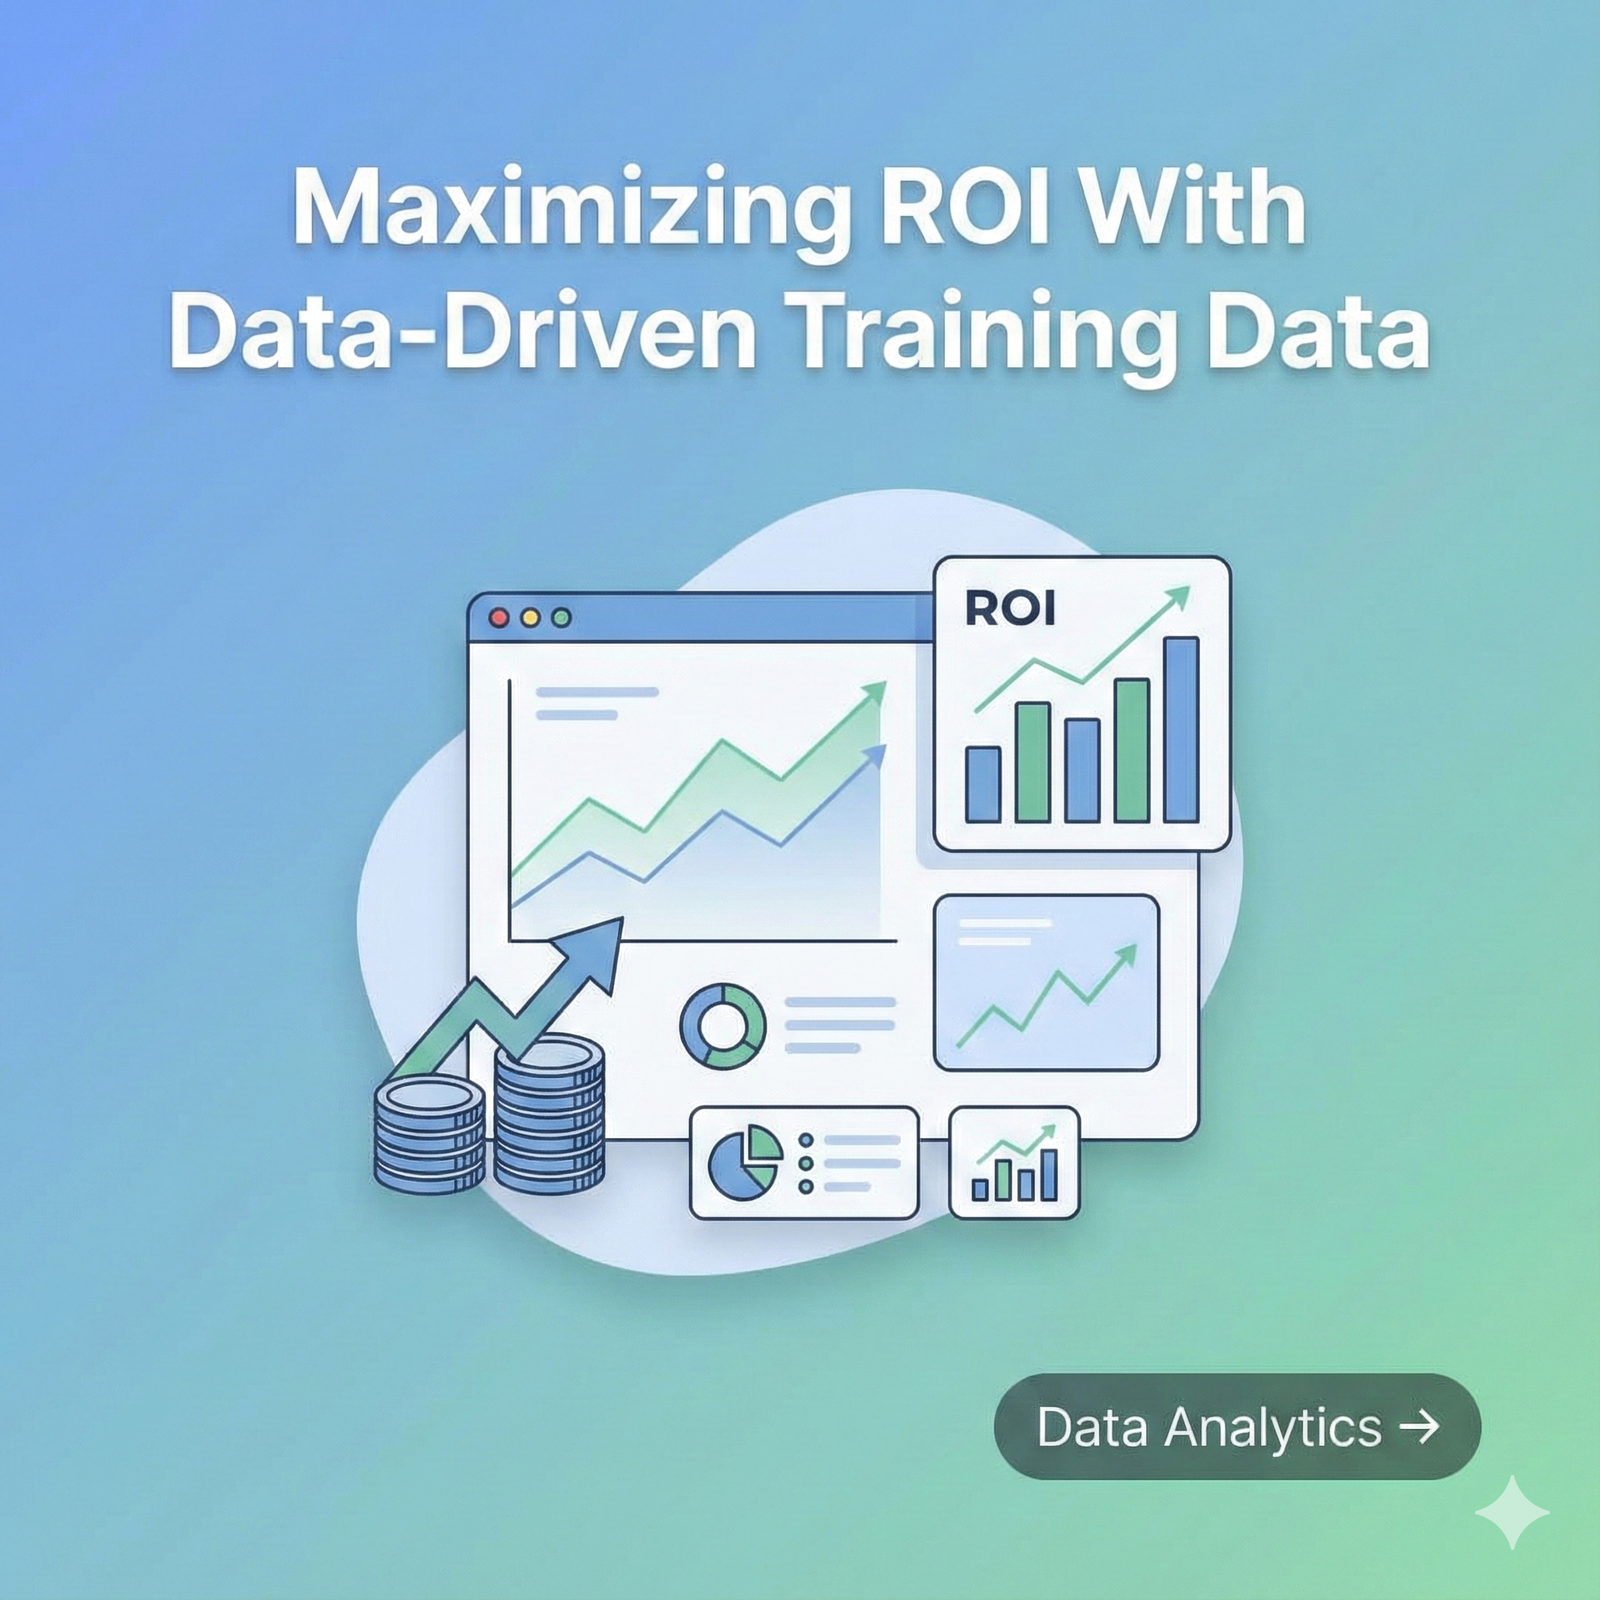
 Move beyond completion rates and use deeper metrics—engagement, interactions, time-on-task, content patterns—to guide strategic learning improvements.

- Learning Analytics Designer
- Data Storyteller
- LRS Configuration
- Dashboard Visualization
- Reporting Structure
- Training Strategy Insights


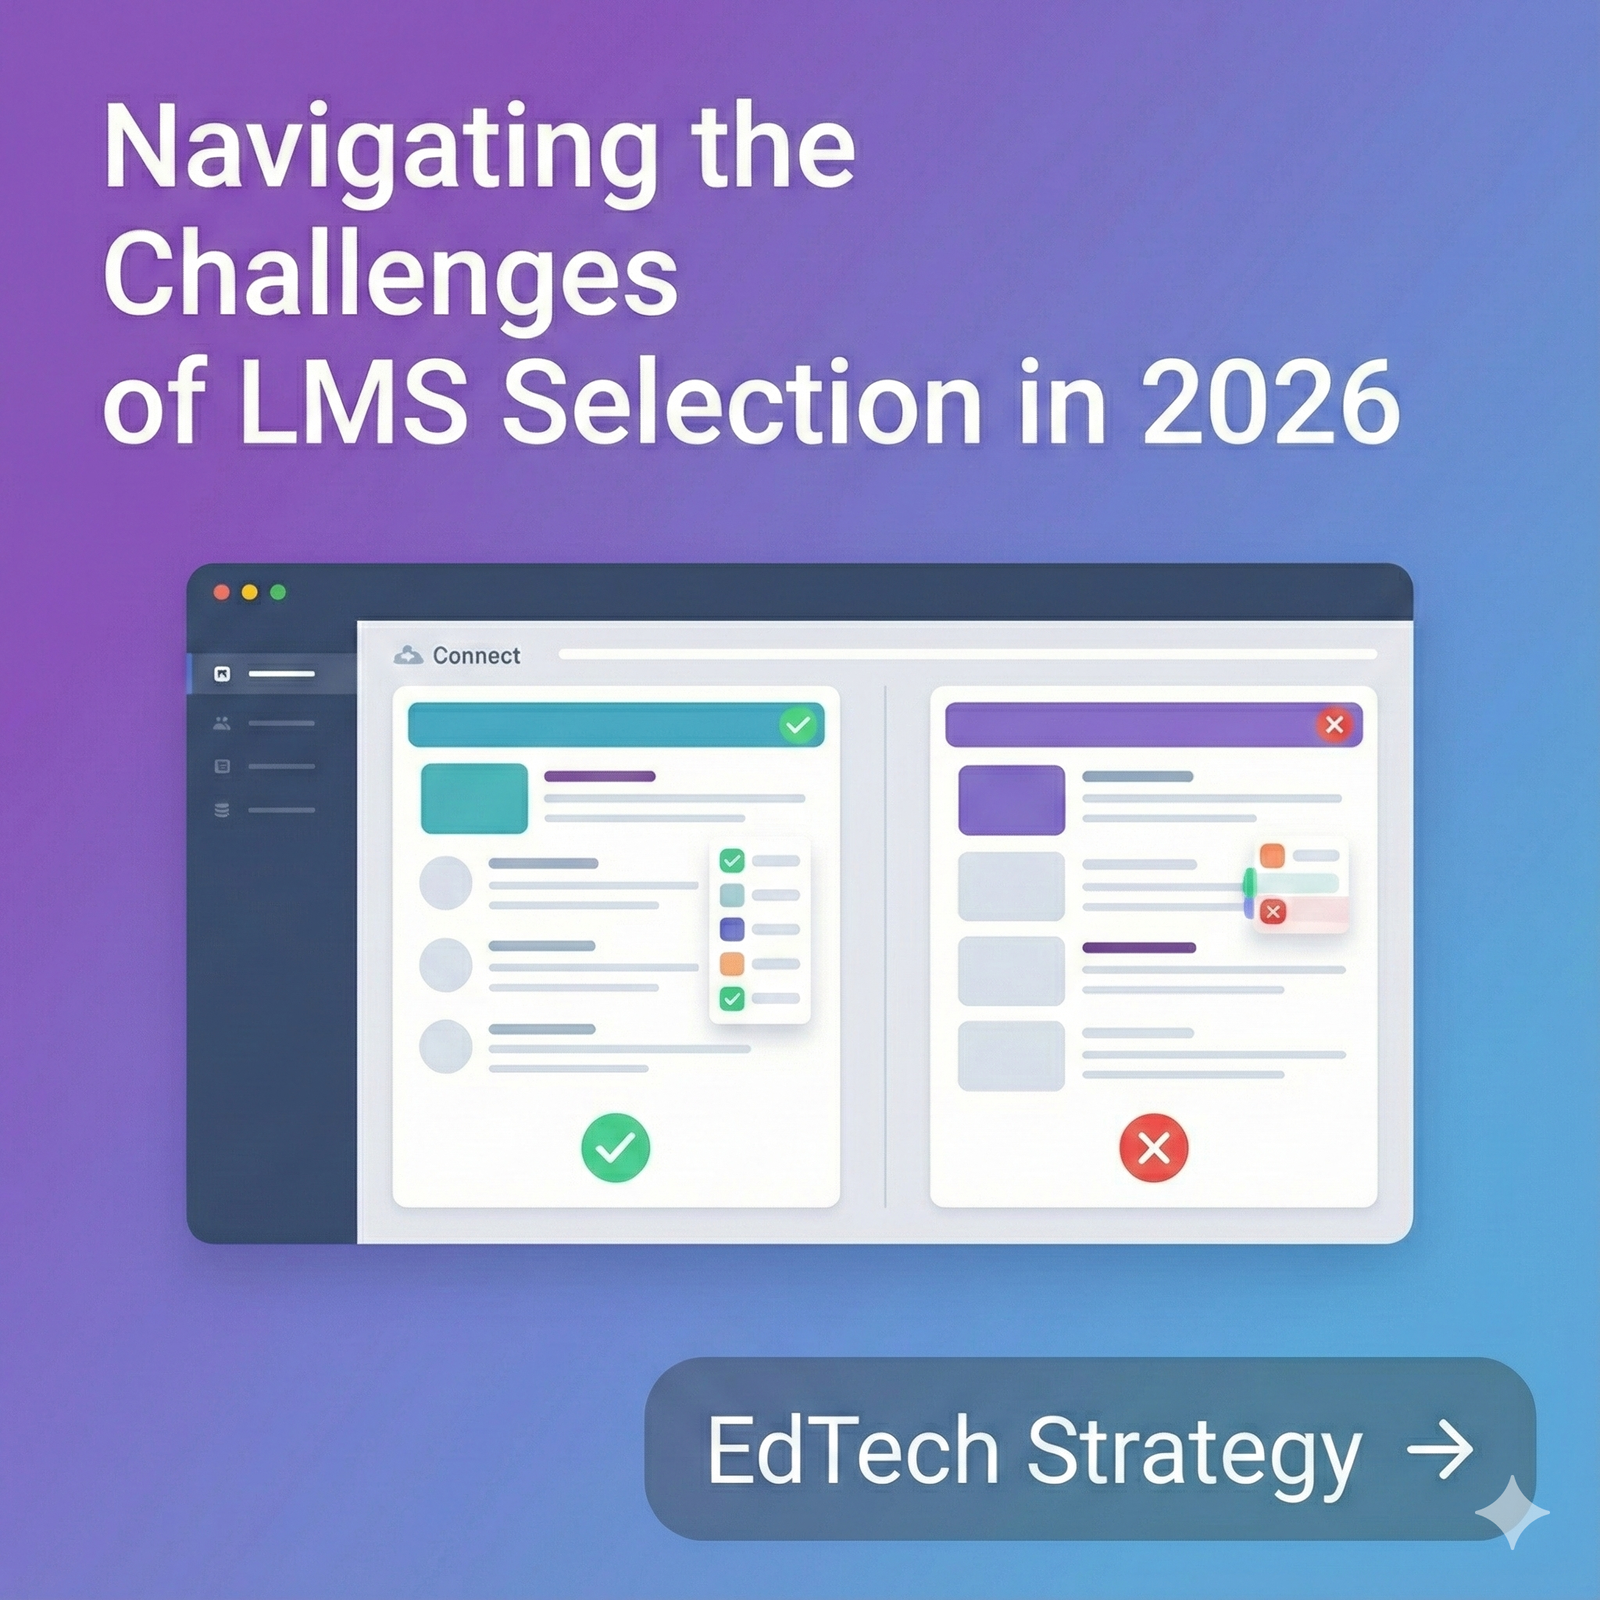
BEFORE → AFTER VISUAL STORY (top block)
Before:
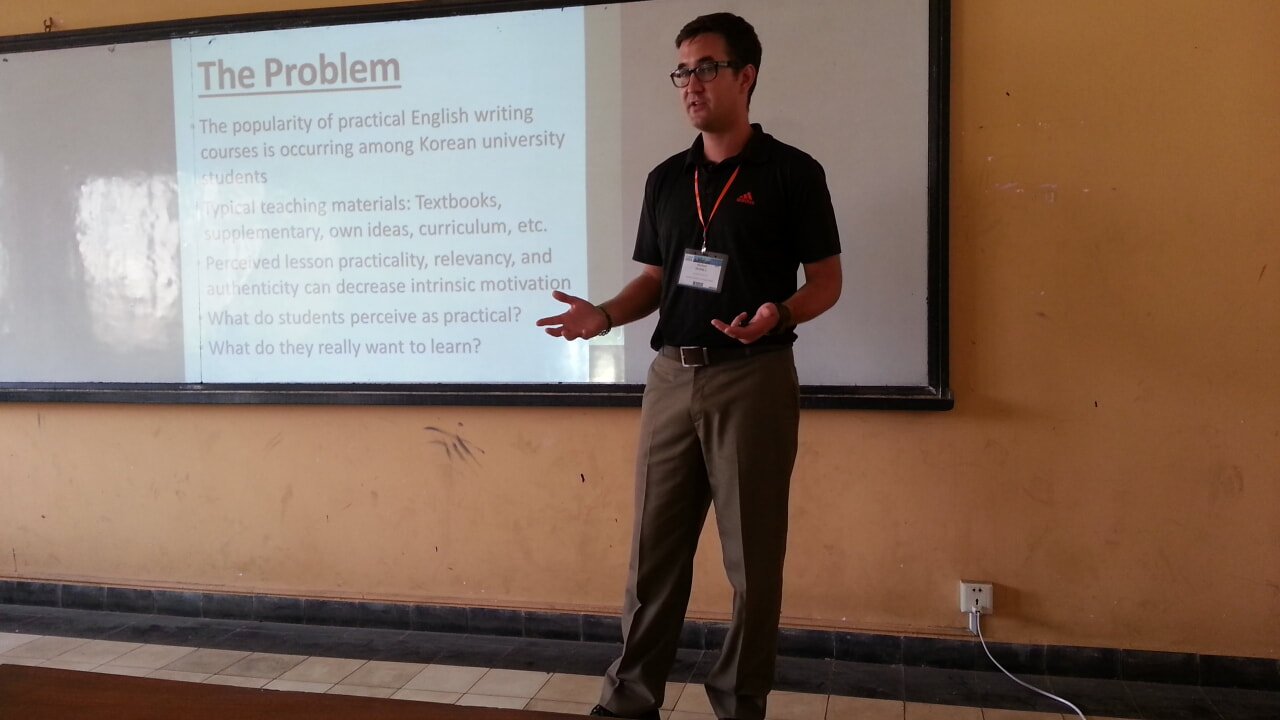
Training performance was difficult to measure. Leaders could see completions, but not competency gains, engagement depth, or how training connected to real business outcomes.
After:
A modern Learning Record Store (LRS) centralizes all training interactions. Every click, decision, pathway, and performance outcome is captured — creating a complete learning data ecosystem where organizations finally understand what works, what doesn’t, and what drives real behavior change.
Key Features Included in This LRS Project
-
xAPI event tracking
-
Multi-source data capture (courses, videos, simulations)
-
Custom dashboards for managers + leaders
-
Behavior-level tracking (clicks, paths, time spent)
-
Heatmaps for content engagement
-
Funnel analysis for drop-off points
-
Decision-impact reporting
-
Performance gap identification
-
Exportable reports (PDF/CSV)
-
LMS + LRS integration
-
Automated weekly insights summary
-
Data visualization using charts + cards
(This makes you look technical, strategic, and analytics-capable.)
Impact & Measurable Results